Este trabajo se presenta una aplicación de la técnica de control difuso con el objetivo de controlar la presión en la entrada de una Red Piloto de Distribución de Agua (RPDA), malla, con diversos puntos de consumo. La misma se encuentra presurizada por un conjunto motor bomba y presenta variación del consumo, lo que dificulta la estabilización del control. El controlador difuso implantado en el sistema selecciona una condición excelente de operación referente a las presiones disponibles y el rendimiento del motor, manteniendo las presiones de la red constantes, para atender la demanda. La evaluación del logro energético del sistema operando con la acción del controlador fue realizada en comparación con el sistema operando sin control. De acuerdo a los resultados obtenidos, el controlador difuso fue considerado satisfactorio en el control de la presión del servicio durante la operación de la red de distribución.
INTRODUCCIÓN
Nowadays, drinking water, considering that it is a natural resource, is already limited in some regions. Then, it must be distributed efficiently in sufficient quantity and pressure to meet consumption needs of population. However, supply companies have difficulties to maintain service quality due to aging and wear of structures, equipment and pipelines that make up supply system.
Another factor that also hinders good water distribution service by companies is related to population growth, which average is 3% per year in Brazil. However, in some neighborhoods in major urban centers, it is observed growth rates above this average, as for example, in Bessa neighborhood in João Pessoa city/Paraíba/Brazil, that presented a growth rate of 8.5% per year, according to data from 2000 to 2010 census.
A technique used by sanitation companies to circumvent these difficulties of operating supplies is boosters’ installation in distribution networks, which pressurizes downstream network snippets of its installation. So, it is not necessary to do expansion of existing projects and it serves population of outlying localities with units of the higher terrain.
In order to solve problems cited, some companies, even in the face of a financial resources lack, design and build more economical new supply systems. These systems suppress distribution tanks cost between 20% and 40% of a system final value.
In both situations, boosters and construction of systems without reservoir, pressure distribution on network vary depending on consumption - the greater the consumption, lower pressure and vice versa. This operation has as consequent appearance of leaks and waste of electricity.
According to Carrijo, Reis, Cheung, Soares & Silva (2003), operation of an urban water supply system, in real time, is a very complex task that has received special attention by researchers and other professionals. Thus, the goal would be to supply consumer needs with water demands that have desired pressures, in order to serve them in the most unfavorable points in relation to terrain irregularities and electric energy economy. Then, it is necessary use of a state-of-the-art equipment to postpone extension of producing units provided that there is no increase in number of people served.
Carrijo et al. (2003), also consider that in search of greater efficiency for water supply systems, new hydraulic techniques associated with optimization algorithms have been studied and developed, in order to establish greater reliability in development of rules for operation of water supply systems.
Yang, Wu & Dong (2010), ratify that conventional supply systems, where speed of pumps do not change, are not able to adjust to changes in users' consumption. In addition, they do not optimize water supply and they are still responsible for implementing in excess load on the system, causing waste of energy and damage to networks, pipelines and auxiliary equipment installed therein.
Conventional techniques like Proportional-Integral-Derivative (PID) Controller are used in pumps or pressure regulator valves in order to control hydraulics variables, for correction of water supply in water supply systems. However, PID controller can only be used if a response curve of system is linear, or have a small linearity around an operation point. In case curve is not linear, it may be difficult or even impossible to control hydraulic variables in some systems.
An integrative proportional type pressure controller and PID derivative was used in a water distribution network in Poznán city, Poland. Results were reflected by 2.7% reduction in energy consumption and an estimated reduction of water losses per leak of 20% (Bakker, Rajaewicz, Kien, Vreeburg & Rietveld, 2014).
According to Bezerra, Silva & Gomes (2012), if plant or processes have behaviors depending of variation of parameters, which dislocates operation points, it makes PID controllers be inefficient in its controller action. That is why nowadays moderns’ controllers are being used actually in nonlinear systems and systems with many inputs and outputs.
Still according to Bezerra, Silva & Gomes (2012), in processes optimization and decisions making genetic algorithm is used. It has been used as a great potential probabilistic method to resolve problems, which needs many combinations solutions, whether in studies to project elaboration or operational area. There are many processes, which has a complex behavior and cannot be mathematically described. That is why new controllers, like fuzzy controller were developed. Fuzzy controller uses experience of operators to control this process in an efficient way. In addition, fuzzy controller has an important feature. It executes multiobjective control with conflicting requisition.
Carvalho (2012) developed a controller, using fuzzy logic for distributed pumping systems. Acquisition of rules applied in controller was obtained through several tests using an experimental bench.
Proportional control system and an induced load loss algorithm, through opening and closing of control valves, has been shown to be quite efficient in piezometric pressure control in an Water Distribution Sistem (SDA). Case study was carried out in northeast Italy and resulted in small variations on various reference pressure scenarios, with concomitant reduction of leakage water losses (Creaco & Franchini, 2013).
Pressure management in water distribution networks has been used for more than three decades in order to reduce water losses. In a recent study, a sensitivity evaluation of several parameters was performed, which related mean pressure in water distribution systems with the high values of leakage exponent (Schwaller & van Zil, 2014).
Effectively enforcing water connections in China has been one of the biggest challenges faced in recent years. Effective decision support system (DSS) are critical for managing power consumption of pumping systems and leakage losses. Joint work carried out between China and Italy has demonstrated this advance (Berardi et al., 2014).
Thus, this work will permeate through these operational issues seeking to find solutions through application of fuzzy control technique for a water distribution network, in order to control pressure points in system when there is a consumption variation. In addition, to minimize transients caused by bombs triggering or opening and closing of valves.
MATERIALS AND METHODS
Experimental bench
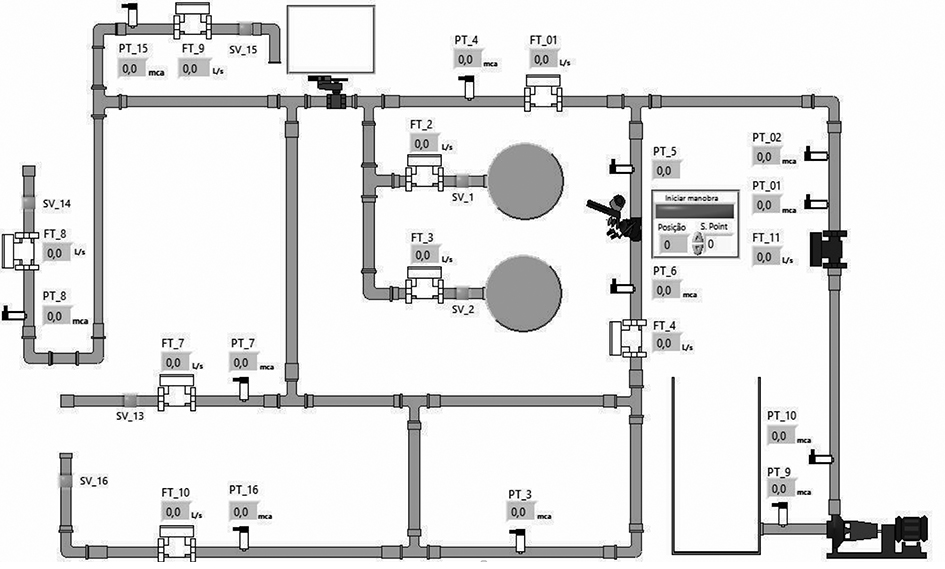
Experimental bench consists of a Pilot Network of Water Distribution (PNWD) pressurized by a pump motor set, totally instrumentalized, as it can be seen in figure 1.
|
|
|
 |
|
|
Figure 1. Design of pilot network of water distribution.
Source: Author’s own elaboration. |
 |
Figure 1. Design of pilot network of water distribution.
Source: Author’s own elaboration. Close |
Distribution network
Supply network emulates a real network. It has 155 m long and it is distributed as follows: Pipes of PVC DN 50 m – 140 m, DN 100 m – 5 m and ductile iron DN 100 m – 10 m. System has 6 (six) water outputs (points of consumption), all controlled by records (manual) and/or solenoids valves in addition to 2 (two) pressure controlling valves (VRPs), 12 (twelve) pressure transducers, 9 (nine) electromagnetic flowmeters type reel, 1 (a) ultrasonic flowmeter and 6 (six) solenoids valves.
Pumping system
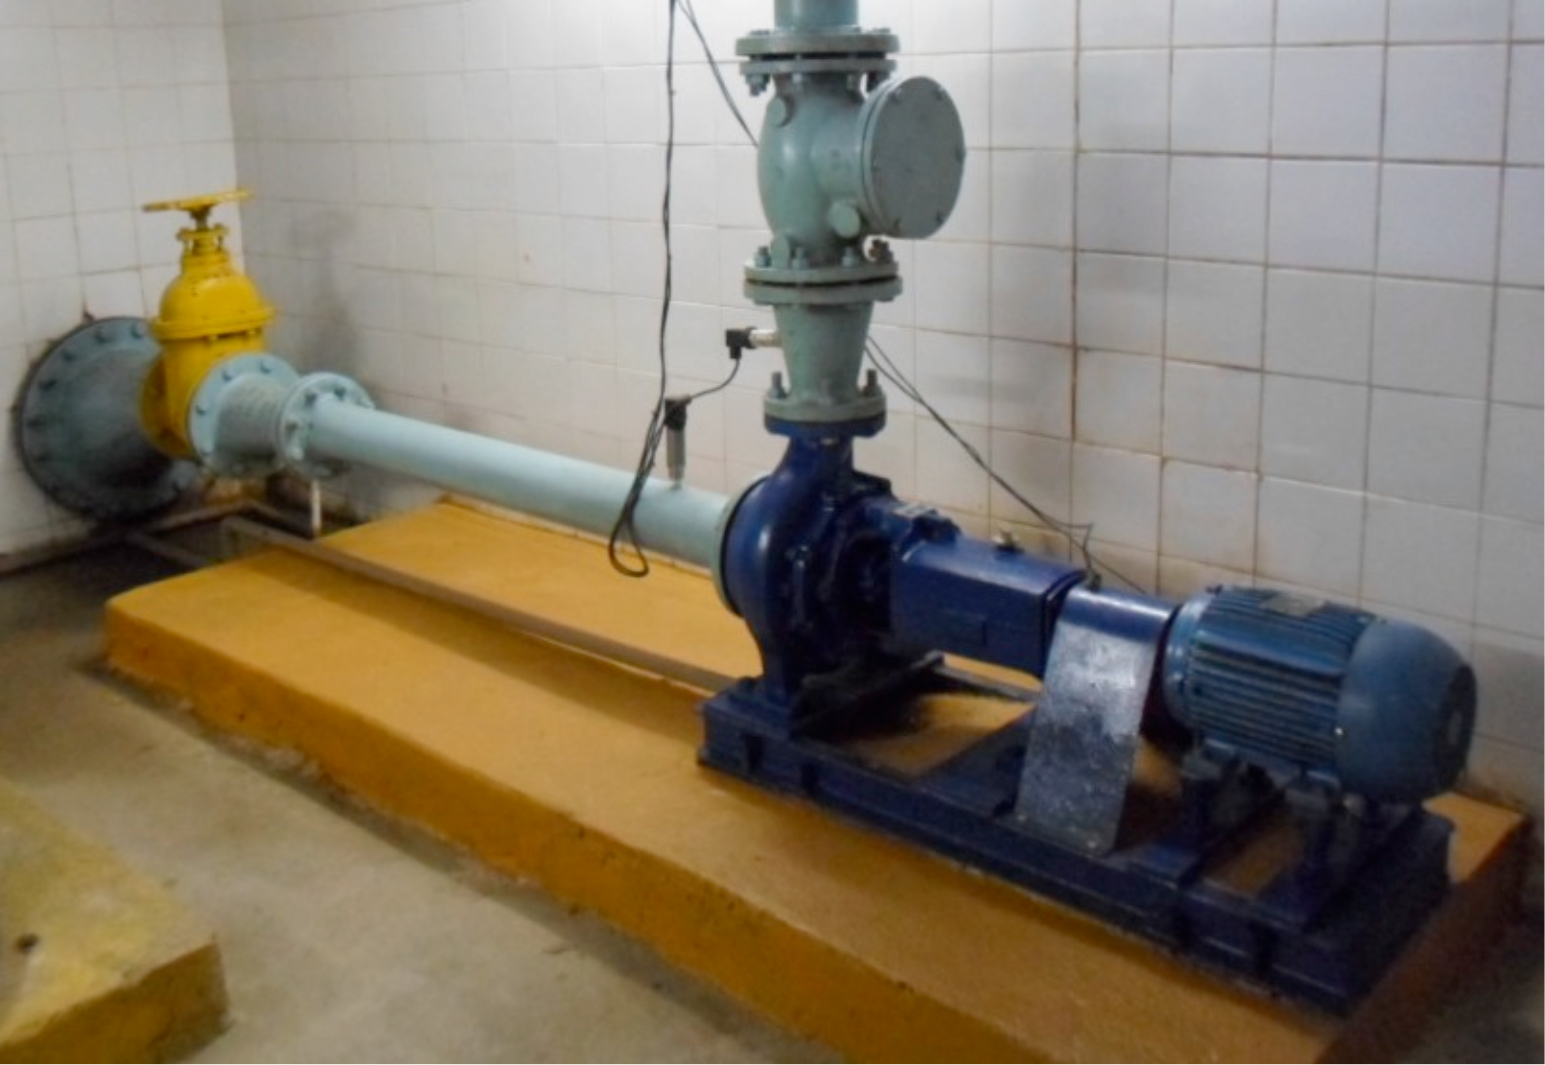
Pumping system is composed of a pump motor set, with 5 CV engine, of a high yield 88%, WEG manufacturing of 1720 rpm, 1.15 service factor, 8A rated current. Manufactured bomb by KSB drives water directly to distribution network with a flow rate of 50 m3/h and a pressure of 17 mca. In figure 2, it is observed motor pump set with detail of its interconnection to system.
|
|
|
 |
|
|
Figure 2. Photo of motor pump set with interconnection detail.
Source: Author’s own elaboration. |
 |
Figure 2. Photo of motor pump set with interconnection detail.
Source: Author’s own elaboration. Close |
Drive panel
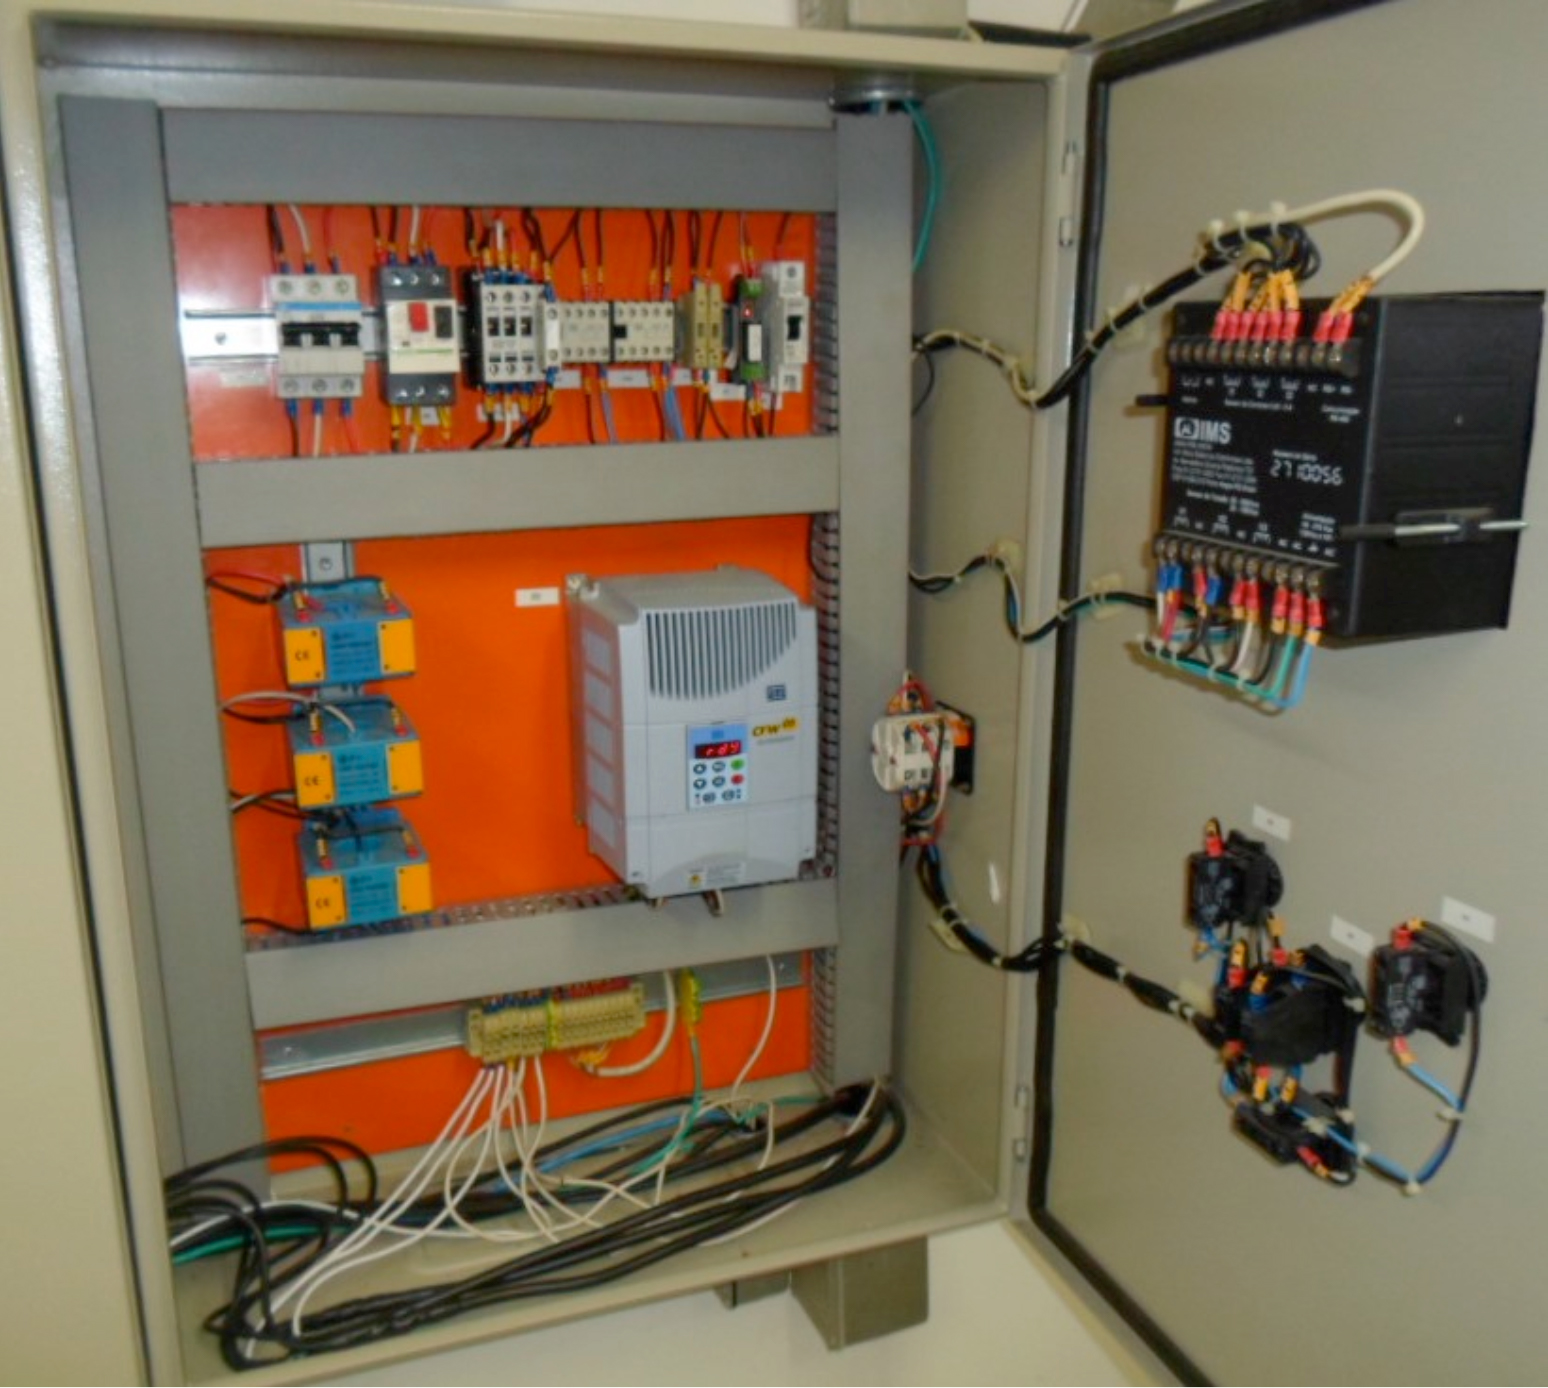
Electric panel operates in accordance with system. It was designed to perform following functions: interface pane between instruments of hydraulic network and supervisory and it serve as control panel and motor protection electronic and electrical equipment, as frequency converter. In figure 3 you can see inside of panel.
|
|
|
 |
|
|
Figure 3. Panel photo with detail of frequency converter.
Source: Author’s own elaboration. |
 |
Figure 3. Panel photo with detail of frequency converter.
Source: Author’s own elaboration. Close |
Fuzzy system
It is able to translate verbal expressions, vague, imprecise and qualitative, in numeric values.
• Fuzzy logic: It converts human experience in a way understandable by computers, in addition to enable application of decision-making strategies in complex problems.
• Fuzzy logic: It is multivalent. It does not impose any sudden limits. Uncertainty managing occurs by expression of terms with certainty in a numeric range [0, 1], and absolute certainty is represented by value 1.
• Fuzzy Controller regulates based on rules.
• These rules are presented in a natural language based on distinguishable characteristics: fuzzy logic.
• Rules are created by operator or by project engineer.
• Fuzzy Control is a branch of intelligent control.
• Fuzzy logic, allows a graduate from false to true. Thus, an air conditioner fuzzy can recognize “hot” and “cold”.
Fuzzy controller
Nonlinearity of a water supply system becomes difficult for classic controllers to act effectively in control of its pressure or flow variables. Combinations of Proportional and Integral control (PI), Proportional and Derivative (PD), or PID when applied to these systems do not maintain variables stability. Thus, fuzzy systems are used in solution of a non-linearity problem. They are robust, versatile and with a great adaptability. If a process operator is able to create rules of form: If then, can control its process. Soon it will be possible to implement a computational algorithm fuzzy.
Fuzzy controller developed to be applied in this plant by controlling pressure can be represented by block diagram of figure 4.
|
|
|
 |
|
|
Figure 4. Schematic design of a fuzzy system.
Source: Author’s own elaboration. |
 |
Figure 4. Panel photo with detail of frequency converter.
Source: Author’s own elaboration. Close |
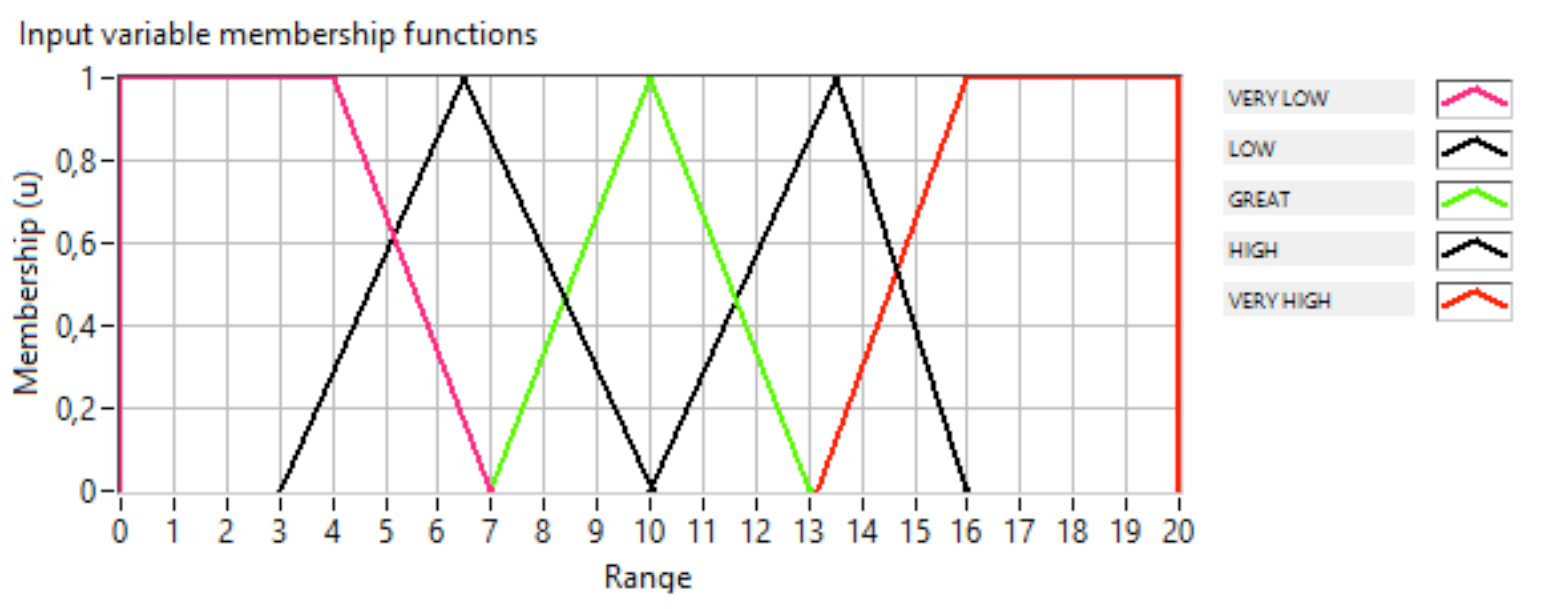
Fuzzification or inferences used two input variables, being the first entry Pressure, whose discourse universe was between [0 to 20], corresponding value to pressure range on network that can be seen in the graph in figure 5.
|
|
|
 |
|
|
Figure 5. Detail of input variable Pressure.
Source: Author’s own elaboration. |
 |
Figure 5. Detail of input variable Pressure.
Source: Author’s own elaboration. Close |
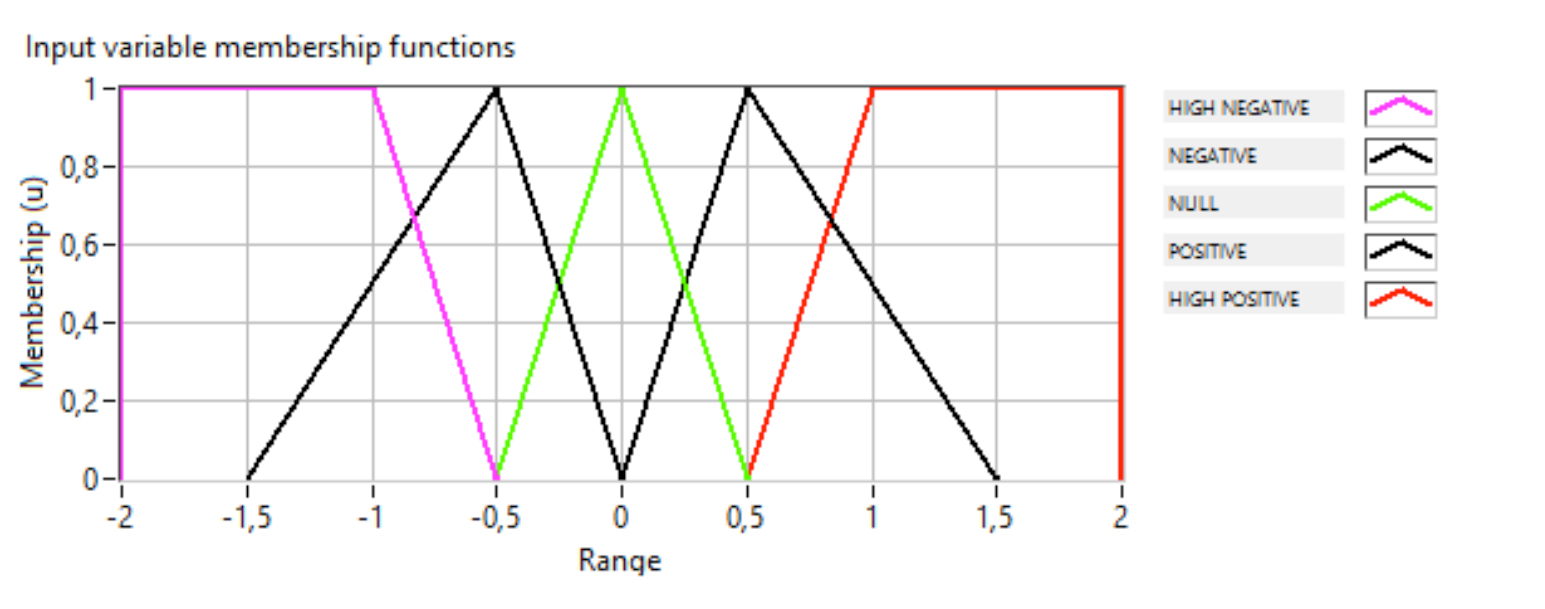
Second input fuzzy controller was defined as Derivative of Pressure, with its discourse universe ranging from [-2 to 2], as it can be observed in graph in figure 6.
|
|
|
 |
|
|
Figure 6. Detail of input variable Pressure.
Source: Author’s own elaboration. |
 |
Figure 6. Detail of input variable Pressure.
Source: Author’s own elaboration. Close |
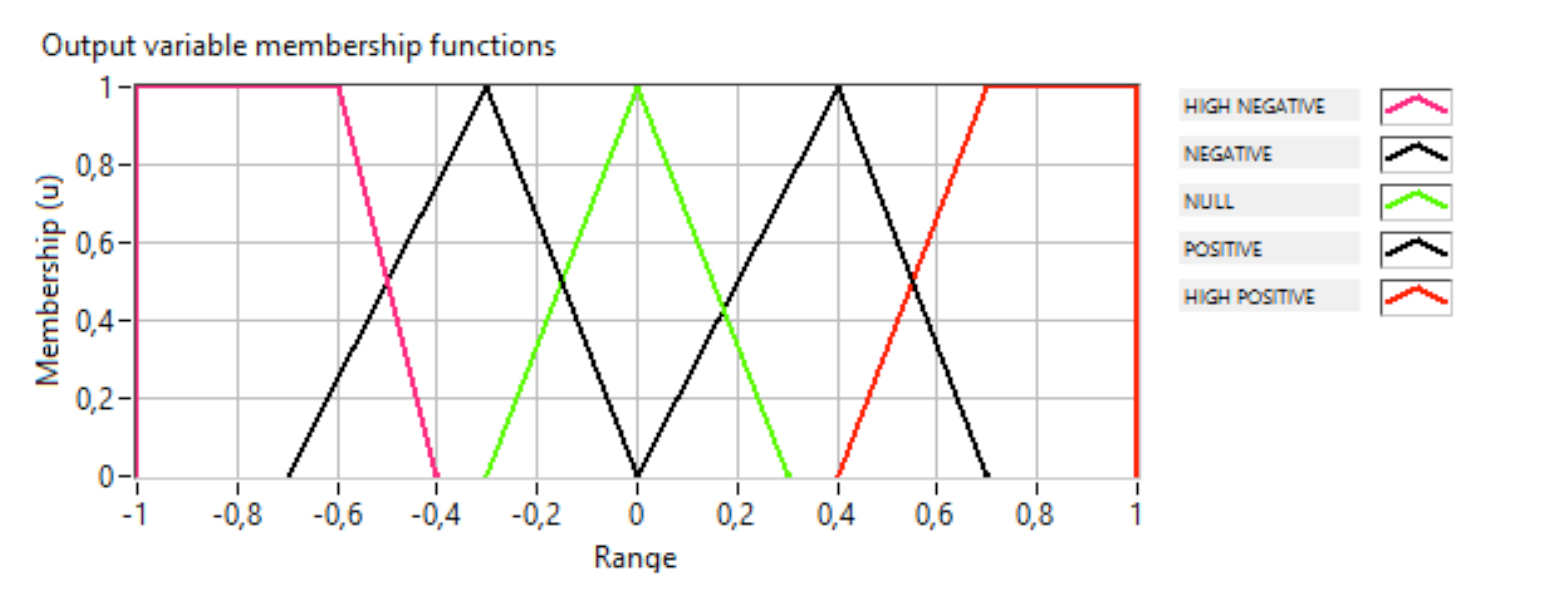
At controller exit occurs defuzzification, where it was used average maximums model (MoM). Discourse universe was between [-1 to 1], according to experimental data, with trapezoidal functions in extremes and, in center, there are triangular functions, as it can be seen in figure 7. This output signal will increment or decrement a delta at motor speed that will run through frequency converter.
|
|
|
 |
|
|
Figure 7. Detail of output variable Delta of Speed.
Source: Author’s own elaboration. |
 |
Figure 7. Detail of output variable Delta of Speed.
Source: Author’s own elaboration. Close |
With inputs and outputs defined, a base of rules was created from water network operation knowledge. In this case all pressure range was contemplated by rules which became controlled.
The following are the 25 rules:
1. If pressure is very low and Derivative of Pressure is high positive then Delta of Speed is high positive.
2. If pressure is very low and Derivative of Pressure is positive then Delta of Speed is high positive.
3. If pressure is very low and Derivative of Pressure is null then Delta of Speed is positive.
4. If pressure is very low and Derivative of Pressure is negative then Delta of Speed is positive.
5. If pressure is very low and Derivative of Pressure is high negative then Delta of Speed is positive.
6. If pressure is low and Derivative of Pressure is high negative then Delta of Speed is positive.
7. If pressure is low and Derivative of Pressure is negative then Delta of Speed is positive.
8. If pressure is low and Derivative of Pressure is null then Delta of Speed is positive.
9. If pressure is low and Derivative of Pressure is positive then Delta of Speed is positive.
10. If pressure is low and Derivative of Pressure is high positive then Delta of Speed is high positive.
11. If pressure is great and Derivative of Pressure is high negative then Delta of Speed is null.
12. If pressure is great and Derivative of Pressure is negative then Delta of Speed is null.
13. If pressure is great and Derivative of Pressure is null then Delta of Speed is null.
14. If pressure is great and Derivative of Pressure is positive then Delta of Speed is null.
15. If pressure is great and Derivative of Pressure is high positive then Delta of Speed is null.
16. If pressure is high and Derivative of Pressure is high negative then Delta of Speed is high negative.
17. If pressure is high and Derivative of Pressure is negative then Delta of Speed is negative.
18. If pressure is high and Derivative of Pressure is null then Delta of Speed is negative.
19. If pressure is high and Derivative of Pressure is positive then Delta of Speed is negative.
20. If pressure is high and Derivative of Pressure is high positive then Delta of Speed is negative.
21. If pressure is very high and Derivative of Pressure is high negative then Delta of Speed is high negative.
22. If pressure is very high and Derivative of Pressure is negative then Delta of Speed is high negative.
23. If pressure is very high and Derivative of Pressure is null then Delta of Speed is negative.
24. If pressure is very high and Derivative of Pressure is positive then Delta of Speed is negative.
25. If pressure is very high and Derivative of Pressure is high positive then Delta of Speed is high negative.
Experimental methodology
Experimental bench was subjected to a consumption variation with and without developed controller action. Analysis of its efficiency was obtained by reading power, in its steady state within each service operation scenarios for each consumer endpoint.
RESULTS
Impulse system was triggered with a constant speed of 1720 rpm. When system stabilization occurred, pressure value was 14.5 mca and flow rate in 42 m3/h, power required by pump at this point of operation was of 4.2 kW. This point represents maximum demand and remaining consumption levels will be below that, and this is the most critical condition of system.
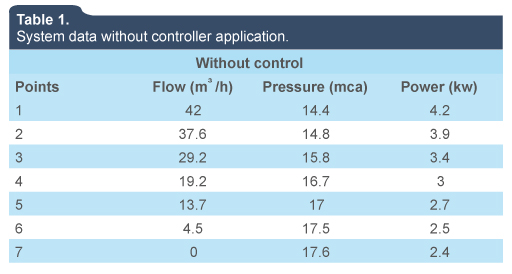
With consumption modification, pressure and flow rate have been changed to intermediate points, until it reaches value 0 m3/h (zero) for flow rate and 17.6 mca for pressure. In this operating point of shut off, registered power was of 2.4 kW. Values of flow rate, pressure and power, in each of operational scenarios simulated, are presented in table 1.
Tabla 1.
System data without controller application.
|
|
Without control
|
|
Points
|
Flow (m3/h)
|
Pressure (mca)
|
Power (kw)
|
|
1
42
|
14.4
|
4.2
|
|
2
37.6
|
14.8
|
3.9
|
|
3
29.2
|
15.8
|
3.4
|
|
4
19.2
|
16.7
|
3
|
|
5
13.7
|
17
|
2.7
|
|
6
4.5
|
17.5
|
2.5
|
|
7
0
|
17.6
|
2.4
|
Source: Author’s own elaboration.
Abrir
 |
Source: Author’s own elaboration. Close |
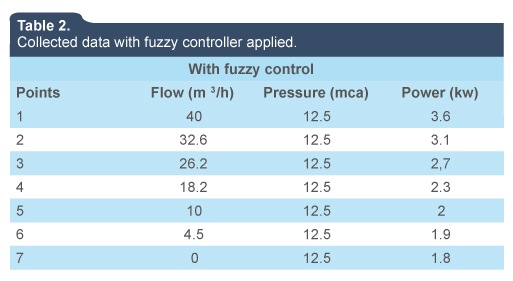
Next step was to submit distribution system, with direct pumping under developed fuzzy controller action, in which engine speed was varied, and this value was adjusted by control system with reference value of pressure in network. This new operation presented values of flow rate, pressure and power different from those have been already registered in another type of operation. New data were collected, as presented in table 2. These values confirm that, with increasing working pressure, leaks and consumption are affected. Therefore, one of positive consequences of control, besides energy consumption reduction, is waste of water reduction.
Tabla 2.
Collected data with fuzzy controller applied.
|
|
With fuzzy control
|
|
Points
|
Flow (m3/h)
|
Pressure (mca)
|
Power (kw)
|
|
1
40
|
12.5
|
3.6
|
|
2
32.6
|
12.5
|
3.1
|
|
3
26.2
|
12.5
|
2.7
|
|
4
18.2
|
2.3
|
3
|
|
5
10
|
12.5
|
2
|
|
6
4.5
|
12.5
|
1.9
|
|
7
0
|
12.5
|
1.8
|
Source: Author’s own elaboration.
Abrir
 |
Source: Author’s own elaboration. Close |
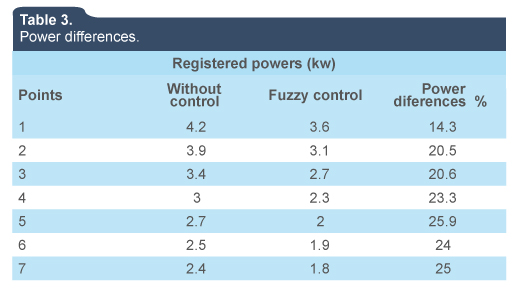
Comparing values between tables 1 and 2, it is possible to show a decrease in power values in all points raised in system, being the biggest difference of 0.8 kW. Potency decrease, in percentage value, of each point is presented in table 3.
Tabla 3.
Power differences.
|
|
Registered powers (kw)
|
|
Points
|
Without control
|
Fuzzy control
|
Power diferences %
|
|
1
4.2
|
3.6
|
14.3
|
|
2
3.9
|
3.1
|
20.5
|
|
3
3.4
|
2.7
|
20.6
|
|
4
3
|
2.3
|
23.3
|
|
5
2.7
|
2
|
25.9
|
|
6
2.5
|
1.9
|
24
|
|
7
2.4
|
1.8
|
25
|
Source: Author’s own elaboration.
Abrir
 |
Fuente: Elaboración propia a partir de Metodología de Sistemas Suaves (Checkland, 1994) Close |
The highest percentage in power differences between two types of operation occurred in point 7, and it was 25%. At this point, flow rate is close to zero in two models of operation. But pressure was 17.6 mca for system that operates without presence of controller, and 12.5 mca for system which operates under action of fuzzy controller. So, the smallest percentage difference occurred in point 1. Anyway, this difference was above 14%. At this point, pump was operating in its maximum capacity of repression with flows from 42 m3/h and 40 m3/h, respectively, for both operational models.
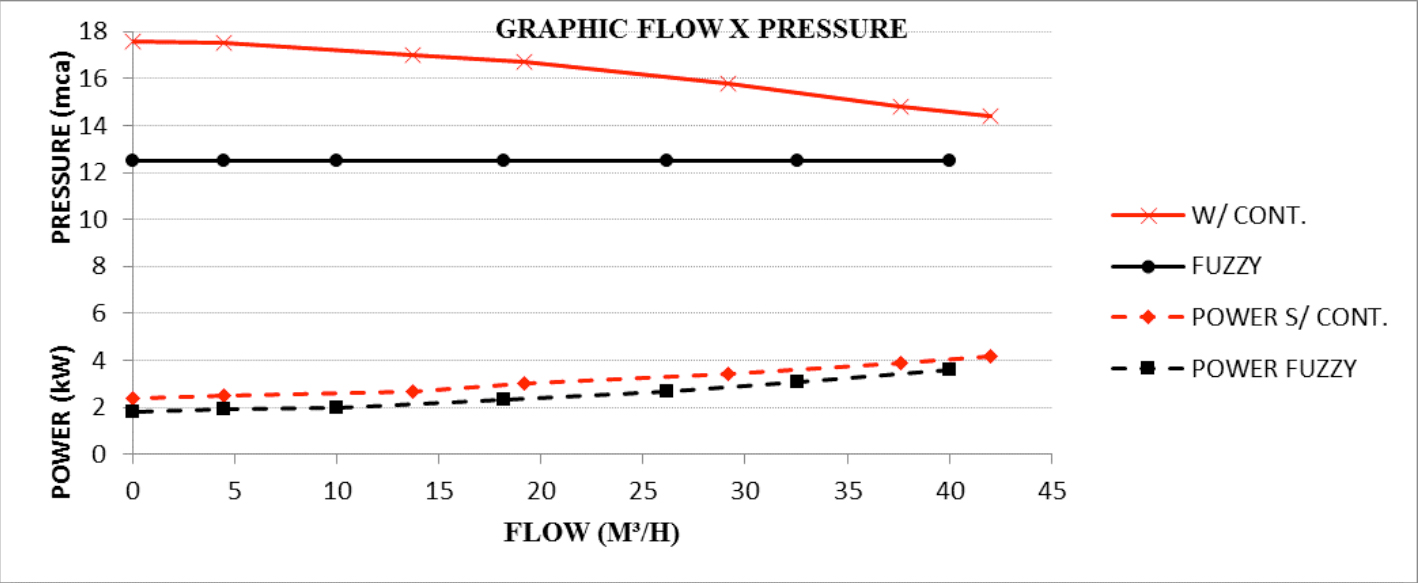
In figure 8, it can be seen graph with data flow rate, pressure and power, when system was operating without the fuzzy controller and under its action.
|
|
|
 |
|
|
Figure 8. Graph of curve of head height with pump operating with no fuzzy control and under controller action
Source: Author’s own elaboration. |
 |
Figure 8. Graph of curve of head height with pump operating with no fuzzy control and under controller action
Source: Author’s own elaboration. Close |
This graphic with two curves of pump head height and its respective power curves was made from seven operation points data. First curve (red curve) represents operation without fuzzy controller actuating. In this case pressure ranges from 14.4 (mca) to 17.6 (mca) and water flow rate from 42 (m3/h) to near zero. Second curve (black curve) represents operation within fuzzy controller actuating. In this case pressure remains constantly at 12.5 (mca) and only water flow rate from 40 (m3/h) to near zero. Each pressure and flow rate point corresponds to a power value in (kW). We can notice that registered values of power without control is always bigger than registered values within the fuzzy controller actuating.
Analysis of results
Results with system operating under fuzzy controller action proved that they are efficient; there was a reduction of 14.3% in the maximum flow and 25% for a minimum flow.
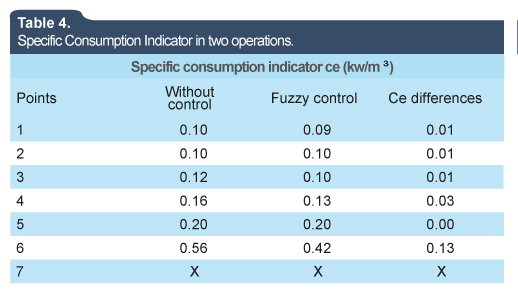
For a better evaluation of system was proposed use of indicator of specific energy consumption (EC), which represents ratio of electric power by volume pumped (kW m3). This bookmark has already been well spread as hydro energy analysis tool for water production systems.
For the first examined point, EC was of 0.010 kW/m3, and other points are laid out in table 4.
Tabla 4.
Specific Consumption Indicator in two operations.
|
|
Specific consumption indicator ce (kw/m3)
|
|
Points
|
Without control
|
Fuzzy control
|
Ce differences
|
|
1
0.10
|
0.09
|
0.01
|
|
2
0.10
|
0.10
|
0.01
|
|
3
0.12
|
0.10
|
0.01
|
|
4
0.16
|
0.13
|
0.03
|
|
5
0.20
|
0.20
|
0.00
|
|
6
0.56
|
0.42
|
0.13
|
|
7
X
|
X
|
X
|
Source: Author’s own elaboration.
Abrir
 |
Source: Author’s own elaboration. Close |
Analyzing data presented in table 4, it can be concluded that system, when operating under fuzzy controller action, proved to be more advantageous in relation to operating system without controller action. These values of EC differences, that represent energy gains have been all positive, with exception of point 5, where value was practically equal in two modes of operation. At this point, fuzzy controller does not have much influence. However, in other fuzzy controller always shows that it is advantageous.
In addition to energy analysis, pressure control provides an improvement in water supply service, relating to waste of water reduction and life-time extension of distribution network, and in accessories installed on it.
CONCLUSIONS
Pumping system when operated without fuzzy controller action presents an indicator of Specific Consumption EC greater than under control system action.
Thus, it was possible to notice a gain of at least 14.3% energy in maximum flow condition, and 25% to the minimum flow.
With data recorded and power flow, it was possible to calculate Specific Consumption EC indicator. This indicator confirms gain in operating mode with fuzzy that ranged from 0.13 (kWm3) to 0.01 (kWm3).
Consequently, you can see that fuzzy control technique applied to water distribution system will enable significant energy gains.
Recommendations for this work improvement is that it was deployed in a real network with similar characteristics of distribution, where a motor pump inject water directly on network.
REFERENCIAS
Bakker, M., Rajewicz, T., Kien, H., Vreeburg, J. H., & Rietveld, L. C. (2014). Advanced control of a water supply system: A case study. Water Practice and Technology, 9(2), 264-276.
Berardi, L., Liu, S., Laucellii, D., Xu, S., Xu, P., Zeng, W., & Giustolisi, O. (2014). Energy saving and leakage control in Water Distribution Networks: A joint research project between Italy And China. Procedia Engineering, 70, 152-161.
Bezerra, S. M., Silva, S. A., & Gomes, H. P. (July, 2012). Otimização operacional de redes de abastecimento de água usando um sistema fuzzy. Water SA, 38(4).
Carrijo, I. B., Reis, L. R., Cheung, P. B., Soares, A. K., & Silva, F. G. (2003). Otimização da operação de sistemas de distribuição de água utilizandoo algorítimos genéticos multiobjetivo. In Anais do XV Congresso Brasileiro de Recursos Hídricos.Retrieved November 20th 2014 from http://www.bwd.com.br/geasd/fotos/gea publicacoes18.pdf
Carvalho, P. S. (2012). Controle para bombeamento distribuído com vistas à minimização dos custos energéticos aplicado a sistemas de abastecimentos de água. Doctoral dissertation, Universidade Federal da Paraíba.
Creaco, E., & Franchini, M. (2013). A new algorithm for real-time pressure control in water distribution networks. Water Science and Technology: Water Supply, 13(4), 875-882.
Schwaller, J. & van Zil, J. E. (2014). Modeling the pressure-leakage response of water distribution systems based on individual leak behavior. Journal of Hydraulic Engineering, 141(5), 04014089.
Yang, Z., Wu, L., & Dong, X. (2010). Control System Desing for Contant Pressure Water Supply, second International Conference on Multimedia and Information Technology.